Corrosion product monitoring (e.g. total iron) is essential to determine the effectiveness of applied cycle chemistry treatment program in a power plant. The monitoring of corrosion products is required by IAPWS, EPRI and VGB standards.
The corrosion products consist of both dissolved and particulate oxides (iron and copper), which are transported and deposited throughout the water-steam cycle. The majority – more than 95% – are present as undissolved particles.
The determination of total corrosion product oxides, which includes particulate and dissolved compounds, is realized traditionally by manual grab sampling and laboratory analysis, which is a complex and time consuming task.
Sample points for corrosion product monitoring are boiler/evaporator water, and condensate and feedwater at different locations [1]. In flexible power plants, steam is also controlled because cycling may enhance the exfoliation of oxide layers, which may have an impact on the steam turbine and other critical components (e. g. bypass station).
Customers Main Challenges
Many plants worldwide operate in a flexible manner with frequent startups, shutdowns, and load changes, with higher risk of transportation and deposition of corrosion particles.
The challenge is to monitor corrosion products during these fast-changing conditions in the plant. By taking only grab samples, the likelihood of missing important events as peaks of mobilized corrosion particles is high.
As it can be observed in figure 1, the online turbidity measurement allows continuous monitoring of the presence and the spiking behavior of corrosion particles during the plant startup, load transient and shutdown.
Turbidity measurement helps to evaluate when and where are corrosion products released and transported. Turbidity measurement allows also trend monitoring for corrosion particle levels.
Figure 1:Turbidity online measurements during startup, load transient and shutdown of a combined cycle/HRSG plant with air cooled condenser, on AVT(O) chemical treatment at pH ≥ 9.8.
Result Evaluation –Tips and Tricks
The turbidity analyzer should be equipped with an infrared light source (860 nm), suitable to detect black colored particles (magnetite) and red colored particles (hematite) [2].
Turbidity measurement shows very good sensitivity and high response to variations in the plant load, even particles in the nanometer range are detected [2].
During data evaluation, it is important to not only consider peaks in turbidity but also the duration of the event until the turbidity value is stabilized.
The correlation of turbidity with the concentration of corrosion products depends on particle size and distribution, which are individual properties for each plant and can change over time. Therefore the analysis of total corrosion products in the laboratory is also necessary, with a frequency dictated by the plant operating conditions [1].
Corrosion product trend monitoring with online turbidity measurement is an essential tool to:
Verify the status of applied chemistry treatment, and optimize it if necessary
Support investigation if flow-accelerated corrosion (FAC) is occurring
Develop maintenance strategies related to increased wear and tear on control valves, particle erosion and deposit problems, particle impingement, etc.
Recommendations for Installation and Operation
Analyzers with continuous sample flow monitoring are important to validate turbidity measurements and disregard turbidity peaks caused by reasons not related to process (e.g. manual action in the analyzer by an operator).
The installation of a back-pressure regulator valve up- stream of the turbidity analyzer is recommended to ensure stable sample flow and pressure during load transients for correct measurements, and to keep necessary turbulent flow conditions by draining excess sample.
To avoid any bias in turbidity measurement, it is important to either bypass or remove any filter mesh installed upstream of the turbidity analyzer in the sample conditioning system.
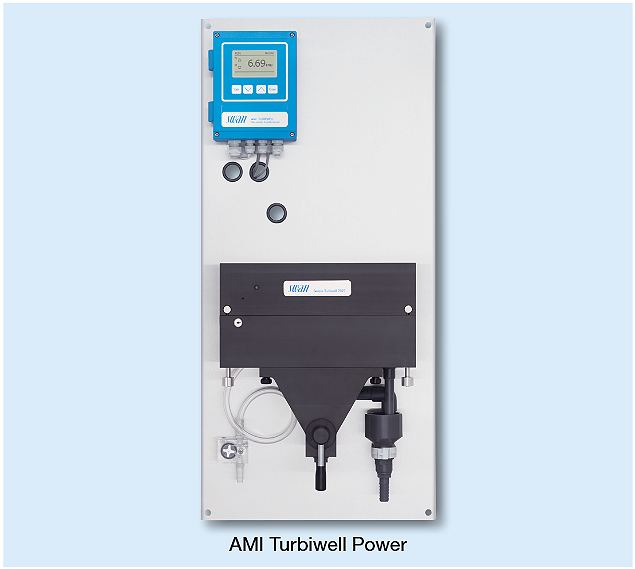
Swan AMI Turbiwell Power Analyzer Advantages
Infrared light source (860 nm)
Sample flow meter with alarm for turbidity measurement validation
Integrated constant head guarantees a constant sample flow into the measuring chamber
Non-contact turbidimeter: system optics are not in direct contact with sample, no fouling on optical surfaces
Manual or automated draining of the measuring chamber for cleaning
Due to the non-contact design, no instrument drift is observed: calibration free Long life LED light source.
References
[1] IAPWS, Technical Guidance Document: Corrosion Product Sampling and Analysis for Fossil and Combined Cycle Plants, TGD6-13 (2014).
[2] Lendi, M., Rziha, M., Staub, L., Turbidity measurement as a trend monitor for particulate corrosion products, VGB Powertech 2019, volume 99 (issue 3).
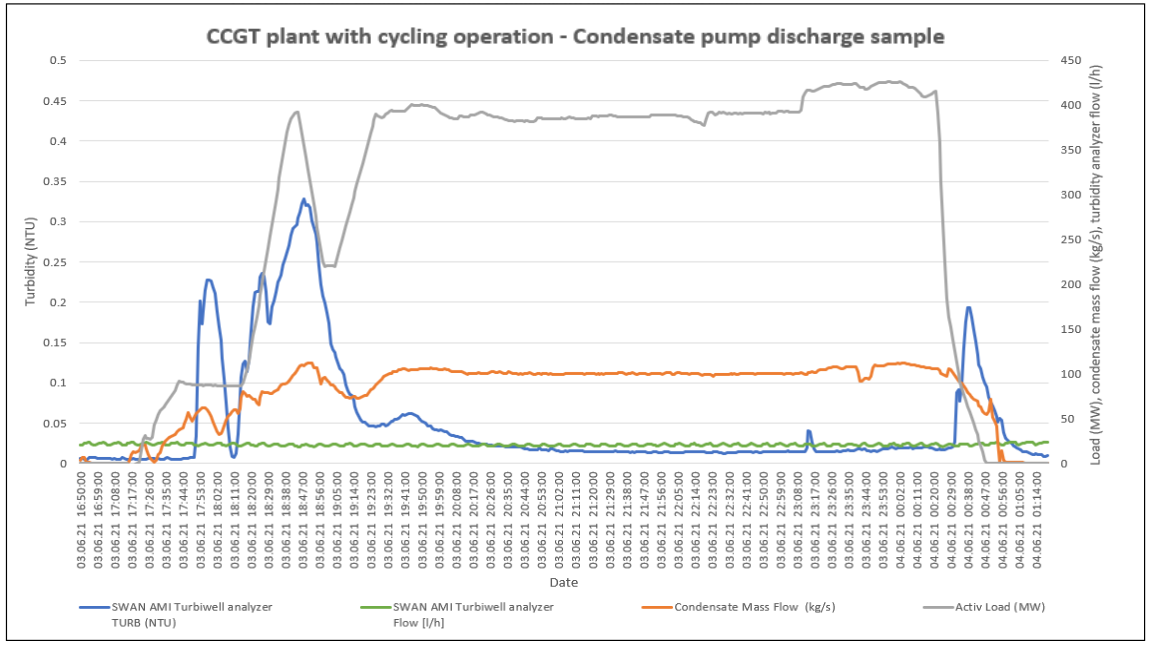 Figure 1: Turbidity online measurements during startup, load transient and shutdown of a combined cycle/HRSG plant with air cooled condenser, on AVT(O) chemical treatment at pH ≥ 9.8.